Dashboard - How to add a dotted line in BI Viewer chart?
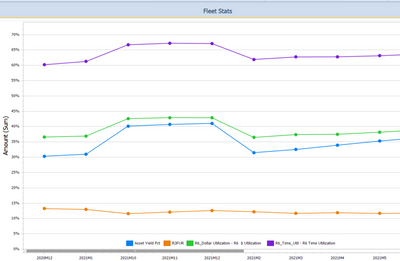
I want to add a dotted line to differentiate between scenarios. In this example - we are reporting actuals and forecast -- Any ideas? Thank you, Mustafa
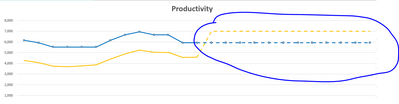
I want to add a dotted line to differentiate between scenarios. In this example - we are reporting actuals and forecast -- Any ideas? Thank you, Mustafa
I'm working with a BI Viewer and working out how to sort the dates within the Time data set. Is their an API that allows to call the data adapter used within a dashboard? Currently the dates on the X-Axis are disorganized and are being sorted based o...
Hi All, As you can see, Oct,Nov,Dec are preceding after Jan 2021. This is being repeated at many several points. I'm wondering if anyone had a similar issue. I'm using a CV MD data adapter. Here is my CV period headers


I'm trying to figure out how to build an expression that pulls "Avg Fleet" numbers and plot a bar chat on an existing pane. I've asked a similar question in this post - I was able to make the syntax work. However I still can not isolate just Avg Flee...
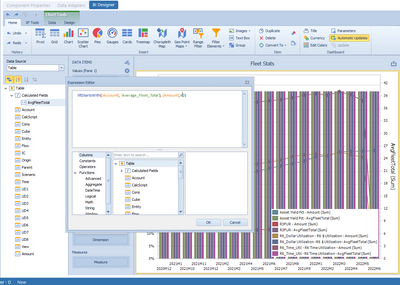
Hey All,I'm trying to add a column (bar) chart on top of this line chart. But I want it to reference and add a dollar based stats account (e.g. Avg Fleet Total) bar chart. I noticed there is a way to add a second axis on the right - so wondering if I...